
Understanding Profit Maximization
Profit maximization is a fundamental objective for businesses and corporations, aiming to optimize their wealth and shareholder returns. In this blog, we will explore the concept of profit maximization using a practical example of a corporation producing and selling photoframes. We’ll discuss the components of revenue and cost, and delve into the relationship between marginal revenue and marginal cost.
To understand profit maximization, we need to first understand profit. Profit is the difference between revenue and cost. Revenue is the total amount earned from selling a product or service, while cost encompasses all expenses incurred in producing and delivering the product.
Consider a photoframe firm selling its frames for Rs 100 each. Revenue is calculated by multiplying the price per unit (Rs 100) by the quantity sold. Let’s assume the corporation sells 100 photoframes, resulting in a total revenue of Rs 10,000.
Revenue = Price per Unit * Quantity
Revenue = Rs 10,000 (i.e. 100 * 100 )
The cost of producing a photoframe consists of labor costs and raw material costs. Let’s assume the cost per photoframe is Rs 90. To calculate the total cost, we multiply the cost per unit by the quantity produced. Assuming 100 photoframes are produced, the total cost would be Rs 9,000. The cost can also be broken down into fixed cost plus variable cost. Fixed cost would entail rents of factory and salary of workers/labors. Variable cost could be the raw materials cost incurred for making frames.
Cost = Cost per Unit * Quantity Cost = Rs 90 * 100 Cost = Rs 9,000 Profit = Revenue – Cost Profit = 10,000-9,000 =Rs 1,000
Now that we understand the components of profit, let’s focus on profit maximization. The objective is to determine the quantity of photoframes that will yield the highest possible profit.
To achieve profit maximization, we analyze the relationship between marginal revenue and marginal cost.
Marginal revenue represents the additional revenue gained from selling one more unit, while marginal cost reflects the additional cost incurred in producing one more unit.
Profit maximization occurs when marginal revenue is equal to marginal cost or when marginal revenue exceeds marginal cost up to a certain point. This is because producing additional units beyond this point may result in diminishing returns and decreased profitability.
Let us consider with an assumed data that for 100 frames, the fixed cost would be Rs 10,000 and variable cost per unit is Rs 30. Therefore, total cost to produce 100 frames is Total Cost = Fixed cost plus variable cost = 10,000 + 30*100 = 13,000
Marginal Revenue = Rs 40, i.e. revenue generated by selling additional unit of frame.
Marginal Cost = additional cost incurred per unit frame say Rs 50 So, in this case Marginal Revenue < Marginal Cost , which means that producing and selling additional units of a product or service is not generating enough revenue to cover the incremental cost of production. In this situation, the business is likely experiencing diminishing returns or inefficiency in its operations and thus profits are not maximised. Thus, efficiency in manufacturing/productions is to be analyzed and decisions are to be taken whether to increase or decrease production quantities to break even or where marginal revenue is greater than or equal to marginal cost. Lets take the examples in multiples of 100 photoframes and the costs associated whereby we have fixed the selling price at Rs 40.
| Quantity | Fixed Cost | Variable Cost | Total Cost | Marginal Cost | Total Revenue | Profit |
| 100 | 10000 | 30 | 13000 | – | 4000 | -9000 |
| 200 | 10000 | 25 | 15000 | 2000 | 8000 | -7000 |
| 300 | 10000 | 20 | 16000 | 1000 | 12000 | -4000 |
| 400 | 10000 | 20 | 18000 | 2000 | 16000 | -2000 |
| 455 | 10000 | 18 | 18190 | 190 | 18200 | 10 |
| 500 | 10000 | 18 | 19000 | 810 | 20000 | 1000 |
| 600 | 10000 | 16 | 19600 | 600 | 24000 | 4400 |
| 700 | 10000 | 16 | 21200 | 1600 | 28000 | 6800 |
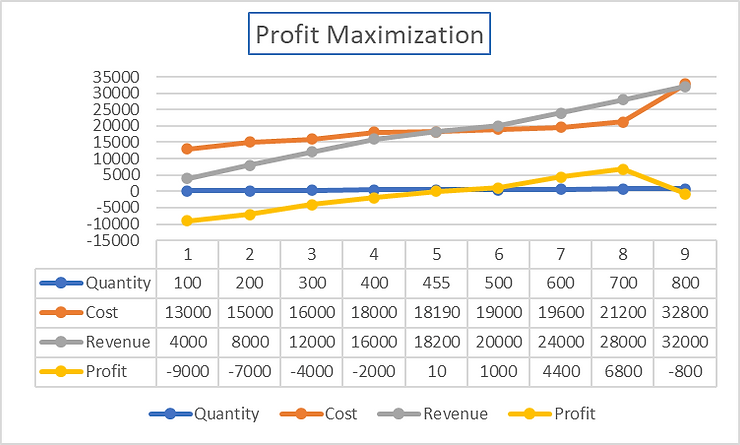
| 800 | 20000 | 16 | 32800 | 11600 | 32000 | -800 |
Profit maximization occurs when there is a maximum gap between total revenue (TR) and the total cost (TC). i.e. @700 quantities , max gap between total revenue and total cost.
In other words, it starts happening when the marginal revenue of production is equal to or more than its marginal cost. (MR = MC).
In this example, the monthly capacity of a factory making frames is optimal at 700, where space and labor constraints are utilized to their maximum and where marginal revenue is greater than marginal costs only at levels of 500, 600 and 700 quantities, wherein the factory is making profits at 500, 600 and 700. But, the maximum profits are only at 700 quantities. The theory of economies of scale can also be understood with this table, wherein breakeven is occurring at quantities between 400 and 500, where we see the profits started moving from negative to positive and at exactly 454 quantities are the profits zero where marginal revenues are equal to marginal costs. As seen from the table, The profit at this level can be assumed to be zero (~10)where marginal revenue= marginal cost.
This simplified example aims to provide a basic understanding of the concept and its calculations. The intricacies of cost structure and types of costings based on industries specific to consideration need to be analyzed in detail for better decision making. Please write to me at sulabh@sslabs.in for any corrections/improvements in the above explanantion.
This 455 frames are solved by solving for equation , marginal revenue = marginal cost 40x=10000+18x (above 400 pieces ,variable cost per frame is Rs18) solving for x(qantities) = 454.5~455 frames At this point in chart , at quantity=455, Profit =0, Marginal Cost = Marginal Revenue at quantity =700, Profit = 6800, Marginal Revenue>Marginal Cost above 700, marginal cost>marginal revenue Upwards of 455 frames, the marginal revenues started becoming greater than marginal costs till 700 frames, at which the profit is maximized. Above 700, the marginal cost again started surpassing marginal revenues wherein, the fixed costs increased due to increased labor costs and overhead costs. Profit maximization is a crucial objective for businesses, focusing on maximizing wealth and shareholder returns. By understanding the components of profit, analyzing the relationship between marginal revenue and marginal cost, and optimizing the quantity produced, businesses can work towards profit maximization. It is important to be diligent in calculations and consider meaningful insights and make informed decisions.
Make Buy Decisions
In the ever dynamic business landscape, strategic decision-making plays a pivotal role in determining a company’s success. AtherEnergy, an Indian electric scooter startup, exemplifies this by adopting a Make Buy strategy to design their own dashboard screens for two-wheelers. This strategic move not only reduced costs but also ensured superior quality and durability, catering specifically to Indian roads and weather conditions. Lets understand this with the example of an Indian Startup – AtherEnergy.
#strategicdecisionmaking#differentiation#innovation#costreduction
#selfreliance#MakeBuyStrategy#sourcingstrategy#corecompetencies#businessstrategy#timetomarket#competitiveadvantage#strategicmanagement#startup#design#atherenergy


